19 Pet Ownership Statistics in 2024: US Facts & Figures

Updated on

Click to Skip Ahead
The link between humans and pets is considerable, as evidenced by the fact that around two-thirds of all US households own at least one pet. This includes common pets like cats and dogs, as well as less-common species like small animals (hamsters, gerbils, etc.) and exotic pets like lizards and snakes. The importance of pets and the roles they play in our lives became even more obvious during the pandemic, with the number of pets increasing globally as well as in the US. Common reasons for owning a pet include companionship and helping improve general and mental health.
Below are 19 statistics related to pet ownership in the US including a breakdown of the types of animals owned and how much we spend on pets each year.

The 19 Pet Ownership Statistics
- There’s a total of 400 million pets in the US.
- Approximately two-thirds of all US households own at least one pet.
- Millennials are the most likely generation to own pets.
- More than three-quarters of pet owners say owning a pet has improved their health.
- Americans spent over $143 billion on their pets in 2023.
- Owners spend nearly $60 billion a year on pet food and treats.
- Dog owners spend between $1,000 and $2,500 a year on their dogs.
- Around 79% of owners do not have pet insurance.
- Pet insurance costs, on average, $48 per month for dogs and $28 per month for cats.
- Nearly 70% of owners include their dogs in family photos.
- There are 65 million pet dogs and 46 million pet cats in the US.
- The French Bulldog is the most popular breed of dog.
- More than 6 million US households own at least one pet bird.
- Nearly 140 million fish are kept as pets.
- There are nearly 8 million pet horses.
- More than 6 million pets are sent to shelters every year.
- 4 million pets are adopted from shelters every year.
- 800,000 shelter animals are returned to owners, but nearly 1 million are euthanized.
- There could be as many as 80 million feral cats in the US.


Pet Owning Households
1. There’s a total of 400 million pets in the US.
(SPOTS)
The United States is a nation of animal lovers and the country’s population of over 330 million people is accompanied by a pet population of more than 400 million. This figure includes cats and dogs which, combined, account for more than a quarter of the total number of companion animals. It also includes small animals like gerbils, hamsters, rats, and mice.
Exotic pets include lizards and snakes, while pet birds include both indoor and outdoor birds. Similarly, pet fish can include aquarium fish and those that live in outdoor ponds.
2. Approximately two-thirds of all US households own at least one pet.
(United States Census Bureau) (APPA)
A household is any home or property that consists of one or more people sharing that property and the bills. There are approximately 125 million households in the US according to the United States Census Bureau’s most recent statistics. Around two-thirds of these households own at least one pet, with many households owning multiple pets.
That means more than 80 million households do have at least one companion animal living with them.
3. Millennials are the most likely generation to own pets.
(World Animal Foundation)
When looking at pet owners and their ages, millennials are the generation that owns the largest portion of the pet population. 32% or nearly a third of pet owners are millennials, compared to 27% that are baby boomers.
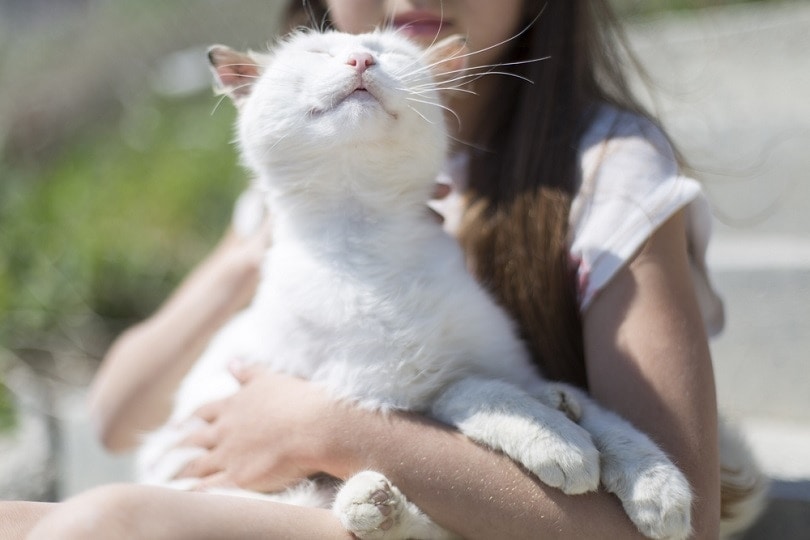
4. More than three-quarters of pet owners say owning a pet has improved their health.
(HABRI)
There are many reasons to buy and keep a pet. During the pandemic and its lockdowns, we certainly discovered the companionship benefits of cats and dogs, and the mental and general health benefits of owning pets have long been known. According to research, 76% of owners say that their general health has improved as a result of owning a pet.
In 2016, this figure was 71%, which likely suggests that more owners are realizing the benefits as a result of the past few turbulent years.

Pet Expenditure
5. Americans spent over $143 billion on their pets in 2023.
(Statista)
Pet ownership does come with certain responsibilities, including making sure the pet has somewhere safe and healthy to live. And many of these responsibilities also come with a financial cost.
In 2023, Americans spent over $143 billion on their pets. This figure includes essentials like pet food and vet care, but it also includes treats and even items like outfits and other non-essentials.
6. Owners spend nearly $60 billion a year on pet food and treats.
(Pet Food Processing)
Of that $143 billion, the biggest expenditure was, unsurprisingly, on pet food. The pet food category includes treats like chews, but the bulk of the money likely goes on regular food. It includes food bought in grocery stores as well as specialty pet food stores and subscription services.
Subscription services are relatively new to the pet food world but were a beneficiary of lockdowns with more people having their pet food delivered in this way. A subscription service means you pay a monthly or regular fee and food is delivered to your door every week or month.

7. Dog owners spend between $1,000 and $2,500 a year on their dogs.
(Market Watch)
Of the household pets, dogs tend to be the most expensive to keep and own. They eat more than cats and they have more expensive toy requirements. It also costs more per vet visit compared to cats.
The average American dog owner spends $1,000–$2,500 a year on their dog, but this figure could be considerably higher or lower depending on the breed of dog, the type of services and products paid for, and whether the dog requires veterinary services during the year.
8. Around 79% of owners do not have pet insurance.
(Forbes)
Veterinary services can be expensive, especially if your pet needs emergency treatment. Some treatments can rack up bills of several hundred or even thousands of dollars and while the majority of owners would willingly pay these amounts if able to, the recent cost of living crisis means that people have less disposable income to cover these costs. Pet insurance offers a means of meeting unexpected costs and emergency treatment, but despite this, more than three-quarters of pet owners say that they do not have pet insurance.
Typically, the most common reason given for not having pet insurance is the perceived lack of value that it offers.
9. Pet insurance costs, on average, $48 per month for dogs and $28 per month for cats.
(Forbes)
Many owners view insurance as an unnecessary expense. You indeed have to pay the monthly or annual premium, even if your pet doesn’t require veterinary treatment. It is also true that insurance does not usually cover routine or preventive treatments.
So, while it can feel like the monthly premium is wasted cash, it can prove invaluable if an owner is hit with a bill for $2,500 for a broken bone, for example.
10. Nearly 70% of owners include their dogs in family photos.
(Forbes 1)
For most pet owners, their animals are members of the family, rather than just pets or possessions. This is especially true of dog owners, likely because they become such an integral part of an owner’s day. According to one survey, nearly 7 in 10 dog owners have included their dogs in family photos.
More than half of owners said they have also made people say hello to their dogs on video calls.

Pet Species Breakdown
11. There are 65 million pet dogs and 46 million pet cats.
(Forbes 3)
Of the 400 million pets in the US, it is cats and dogs that are considered the most popular pet species, although that does depend on the figures you use. There are 65 million dogs and 46 million cats living in households across the country. This means that more people own cats and dogs than any other type of pet, although these numbers are dwarfed by the 140 million fish that are kept as pets.
The number of fish is so high because fish owners generally own a much larger number of fish per household.
12. The French Bulldog is the most popular breed of dog.
(AKC)
The most common type of dog owned in the US or anywhere else in the world is the mutt or mixed breed dog. These can be a cocktail of dog breeds and they make some of the best family pets.
When it comes to pedigree breeds, the French Bulldog is the most commonly owned pet in the US, recently taking the long-held spot from the Labrador Retriever. The 2nd and 3rd most popular breeds in the US are Labrador Retrievers and Golden Retrievers respectively.

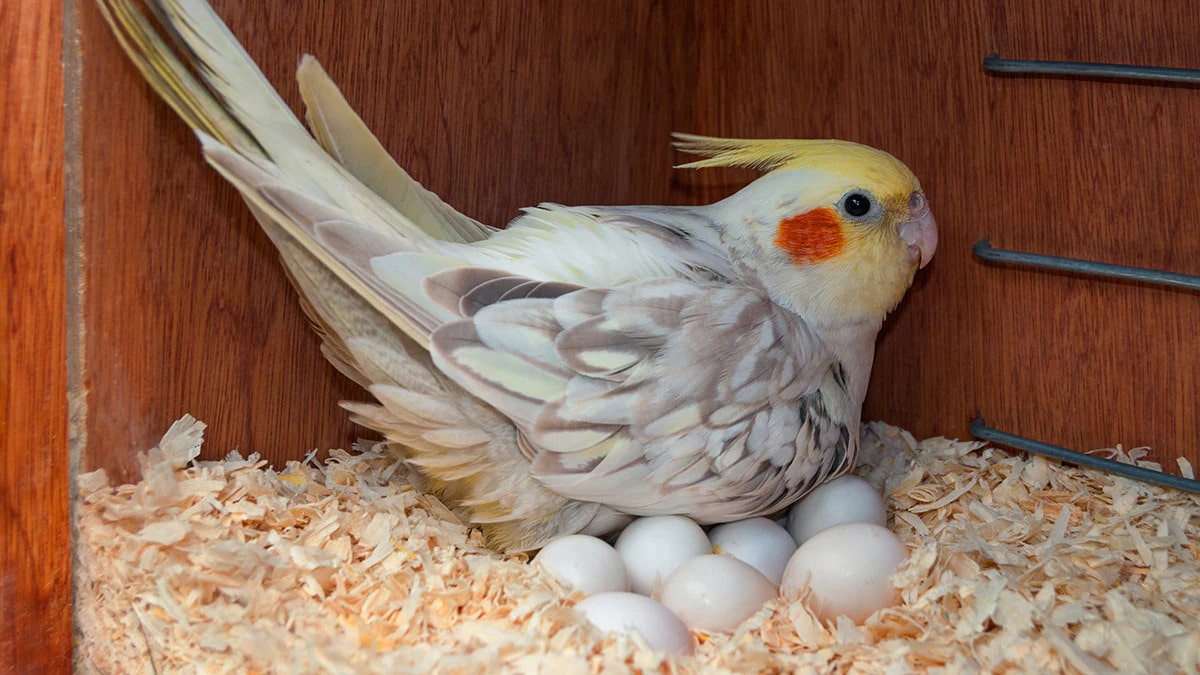
13. More than 6 million US households own at least one pet bird.
(Forbes)
Birds can make great pets. Parrots are popular because they are large birds, some can learn to mimic human words, and they will integrate into the family and enjoy spending time out of their cages. The Cockatiel is a small species and while the majority of Cockatiels are unable to learn to speak human words, they do make sweet pets.
Birds like Finches typically live in aviaries and cages, and they do not need the same kind of personal attention or time out of a cage as the larger, more demanding birds, which also makes these popular pets.
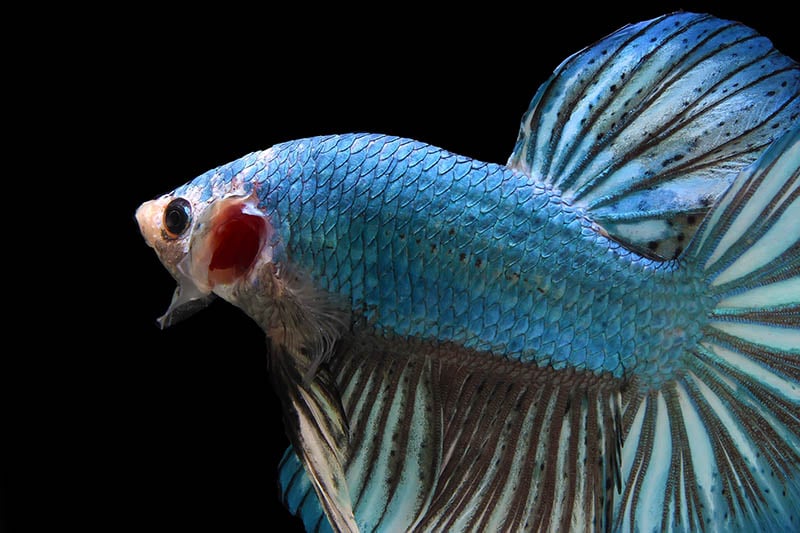
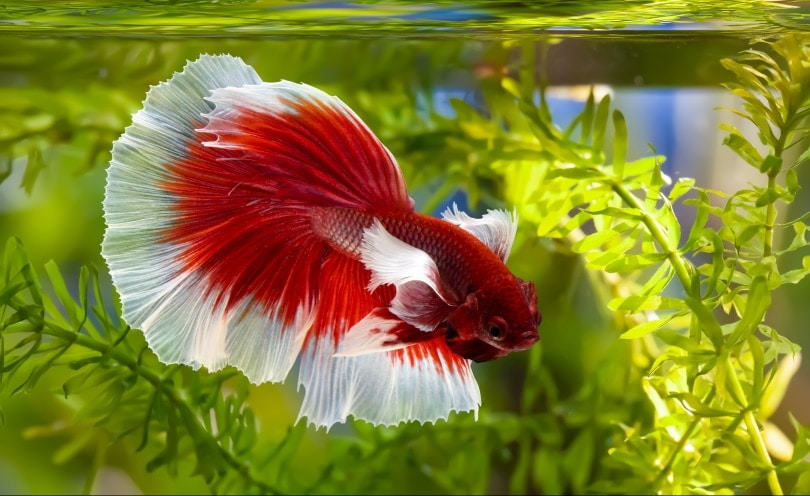
14. Nearly 140 million fish are kept as pets.
(SPOTS)
When it comes to sheer numbers, it is fish that are the most populous pet. There are 140 million pet fish kept across the US which includes freshwater and saltwater fish as well as fish in indoor aquariums and those in outdoor tanks. This means that approximately a third of all pets in the US are our scaled water-loving friends.

15. There are nearly 8 million pet horses.
(SPOTS)
Horses aren’t always deemed as pets because they don’t live in our houses or even on our properties, in some cases. But we do form an emotional attachment to them, and they need us for their health and welfare needs.
They can also improve our general and mental health in the same way as domestic pets can, which is why horse owners do consider them as pets. There are approximately 8 million pet horses across the country.
Rescue & Shelter Animals
16. More than 6 million pets are sent to shelters every year.
(ASPCA)
While the majority of pets live their whole lives with their human families, there is a considerable problem with people having to surrender their pets to shelters and rescues. There are plenty of reasons why animals are sent to shelters, although the most common reason is a problem with the pet, such as destructive or aggressive behavior.

17. 4 million pets are adopted from shelters every year.
(ASPCA)
Owners are typically encouraged to adopt rather than shop, which means adopting a pet from a shelter or charity. Giving a rescue a forever home not only means potentially saving that animal’s life but it tends to be cheaper than buying and many rescue dogs turn out to be exceptional pets when partnered with the right owner and household.
4 million pets are adopted every year, which is an incredible number, but still means more pets are sent to shelters than are rescued from them.
18. 800,000 shelter animals are returned to owners, but nearly 1 million are euthanized.
(ASPCA)
Of the remaining 2 million pets in shelters, 800,000 of them are returned to their original owners. This may occur because the pet got free or ran away, or the original owner may change their mind about giving the animal up for adoption.
Unfortunately, this leaves approximately 1 million pets that are euthanized every year because there isn’t room or resources to keep them in the shelters.

19. There could be as many as 80 million feral cats in the US.
(USDA)
A feral cat is one that has never had a domestic home or that has been living wild long enough that it has reverted to this state. Ferals are different from strays and homeless cats, which have escaped or been abandoned but have come from a domestic home.
There is no way to know exactly how many feral cats there are living in the US but there are estimated to be as many as 80 million.
Frequently Asked Questions
Which state has the highest pet ownership?
Wyoming has the highest pet ownership rate with 71.8% of households owning at least one pet. West Virginia (70.7%), Nebraska (70.3%), and Vermont (70%) are the only other states with more than 70% of households owning pets. (World Population Review 1)
Which country has the highest rate of pet ownership?
Approximately 80% of the population in Argentina and Mexico own pets, which puts them at the top of the list of countries with the highest pet ownership rates. Brazil and Russia also come ahead of America’s 70% with 75% and 73% respectively. (GfK)

What is the number one pet in the world?
Around the world, approximately a third of all households own at least one dog, compared to about a quarter of all households that own cats, making the dog the most popular pet species globally. (World Population Review 2)
Conclusion
Pets are a major part of many peoples’ lives and a part of their families, and it remains true that dogs are a person’s best friend, as they are the most popular pet species in the world. Dogs are also the most popular type of pet in the US where approximately two-thirds of the population own at least one pet and spend around $143 billion a year on their pets.
Featured Image Credit: NDAB Creativity, Shutterstock